Knowing how to assess multiple space-occupying lesions on a CT head is a vital skill for any radiologist on call. In this case, a woman in her 50s presents with confusion, and her CT shows findings that need a structured approach.
We’ll walk through how to identify vasogenic oedema, use contrast and MRI to refine the differential, and apply tools like diffusion weighted imaging to distinguish between infection and malignancy. A key case for anyone taking on emergency work in the hospital.
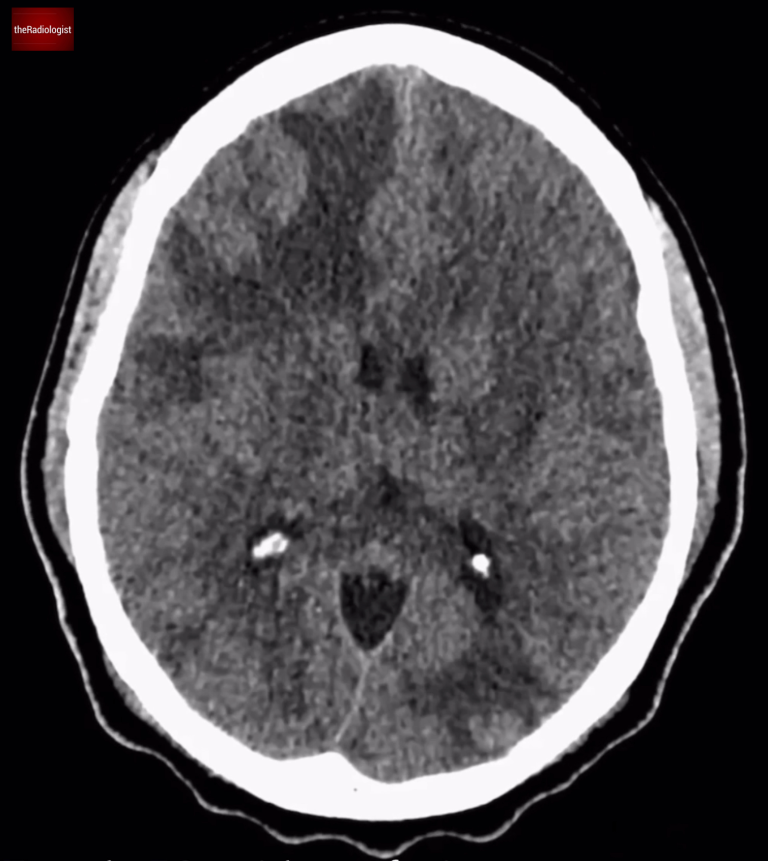
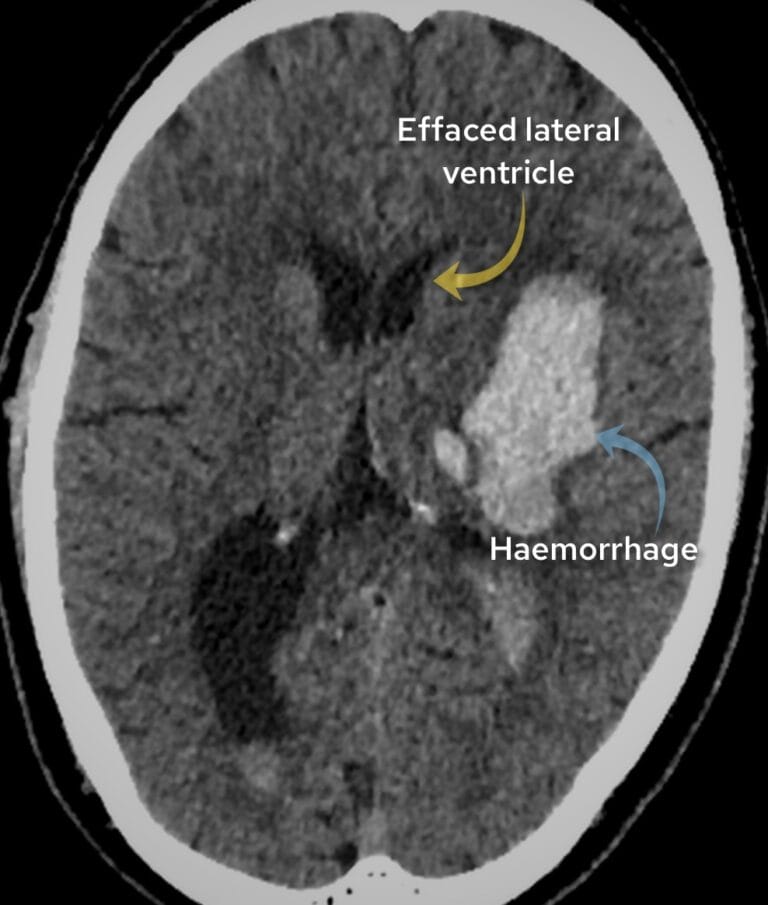
A female in her 50s presents to the Emergency Department with confusion and has a CT head.
Have a look at the images below. What does it show?
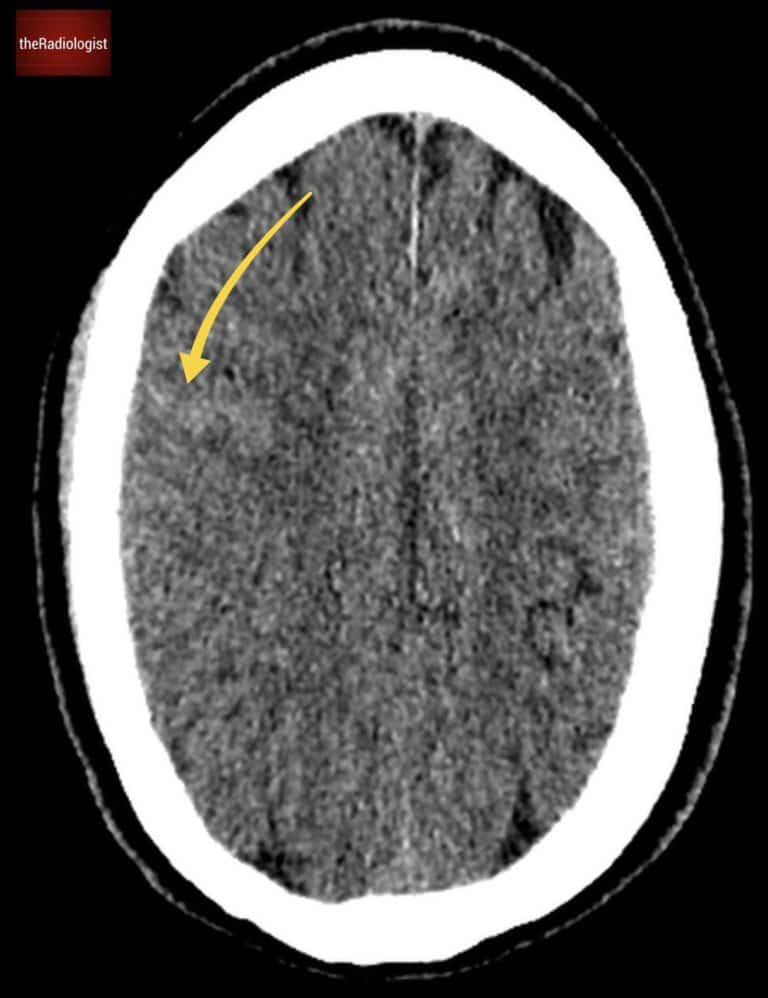
Single axial slice of a non contrast CT head.
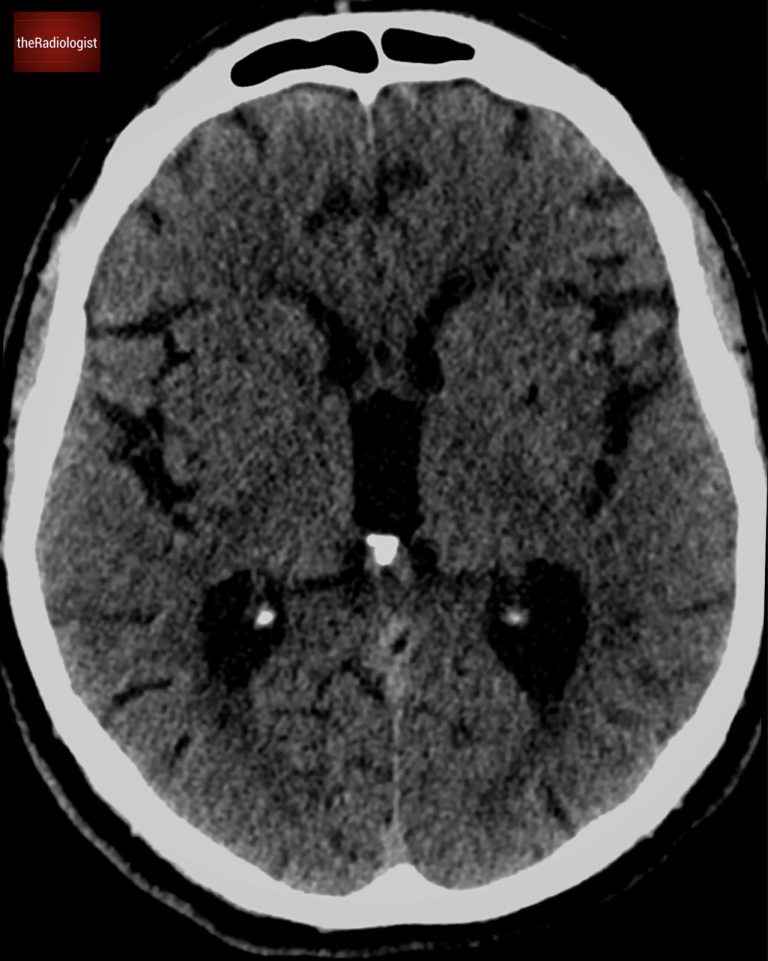
Non contrast CT head, complete scan.
Video explanation
Here is a video explanation of this case: click full screen in the bottom right corner to make it big. If you prefer though I go through this in the text explanation below.
CT scan findings
Let’s take a closer look at this brain CT scan. Looking carefully we will find multiple foci of low density scattered throughout the brain. These areas exhibitfinger-like projections extending to the edge of the brain, a classic pattern indicative of white matter involvement. This finding strongly suggests vasogenic oedema: when you see this you need to consider an underlyingspace-occupying lesion.
Low density with finger-like projections extending out to the edge of the brain suggesting white matter involvement and vasogenic oedema.
Vasogenic versus cytotoxic oedema
To better understand, let’s compare this with cytotoxic oedema, as seen in a stroke. Have a look at the picture below.
In vasogenic oedema, as in our case, only the white matter is affected.
In cytotoxic oedema, like in this case of ischaemic stroke, both the grey and white matter are involved, reflecting cellular damage.
Compare the appearance of a stroke and cytotoxic oedema involving both grey and white matter (left) with space occupying lesions on the right involving white matter only and causing vasogenic oedema with so called ‘finger like projections’ (right)
Let’s look at a table going through the differences:
Vasogenic
Cytotoxic
Cause
Results from disruption of the blood brain barrier allowing fluid and plasma proteins to leak into the extracellular space
Arises from cellular injury, often due to ischaemia. Blood-brain barrier intact. Na+/K+ pumps fail to operate leading to Na+ accumulation within cells, water being drawn in and extracellular water accumulation
Affects
White matter – you may see finger like projections
Both white and grey matter – you will see loss of grey-white matter differentiation
Seen in
Space occupying lesions such as tumour or abscess
Ischaemic stroke, toxic metabolic conditions
Differential for multiple ring enhancing lesions
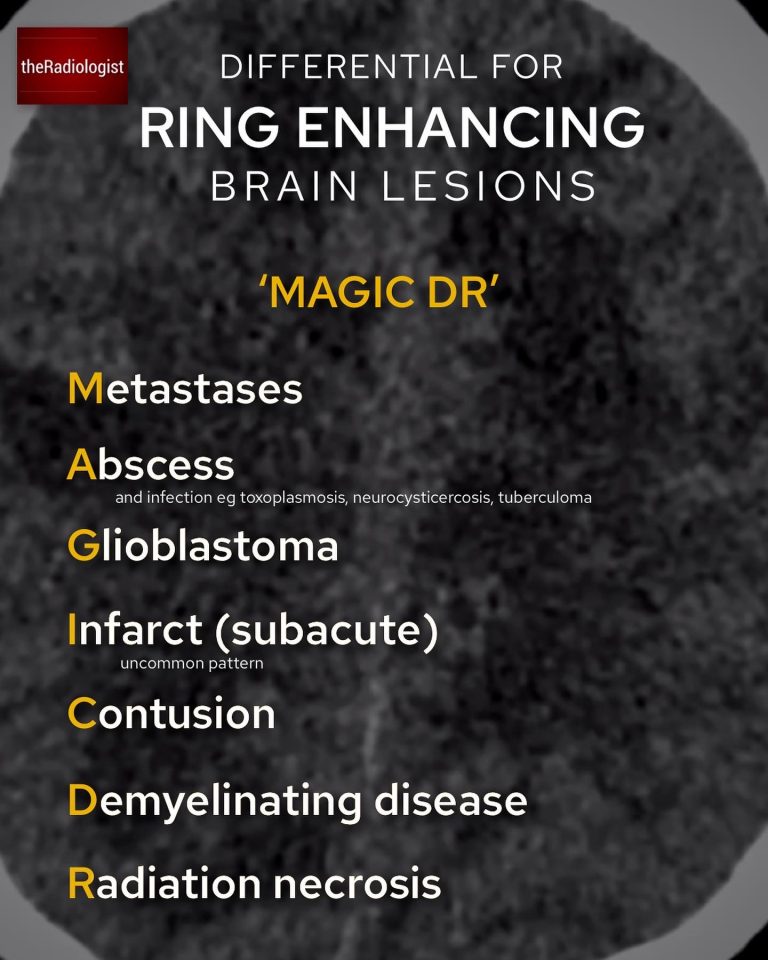
Returning to our case, the administration of IV contrast highlights multiple ring enhancing lesions distributed throughout the brain. These ring-enhancing lesions have a differential diagnosis, famously known as ‘MAGIC DR’.
The reason I like this differential is that the top two causes make up the majority of ring enhancing cases we see in every day practice. That is, you can account for most cases by malignancy (more often metastases) and infection, ie abscess formation.
Use the mnemonic ‘MAGIC DR’ to remember the causes of multiple ring enhancing lesions
Diffusion weighted imaging (DWI)
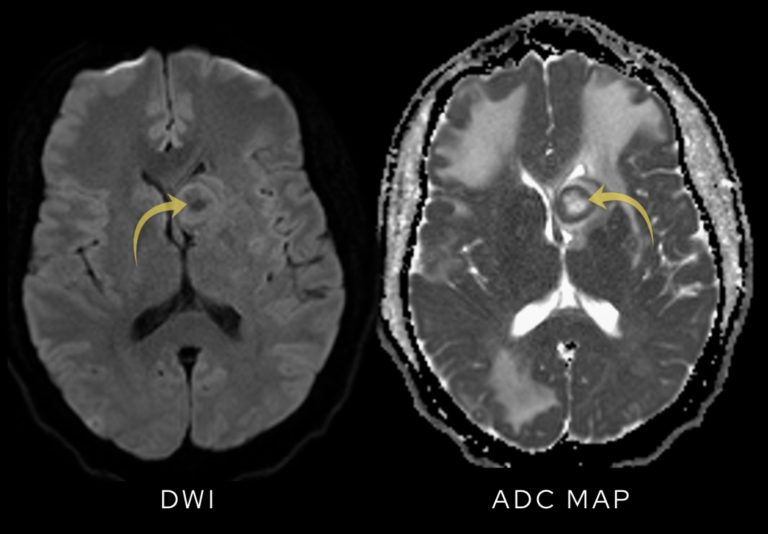
One of the key uses of MRI in these cases is to use diffusion-weighted imaging (DWI) to help differentiate between malignancy and infection.
In abscesses, the presence of pus restricts water molecule movement, causing the lesions to appear bright on DWI.
In this case, the lesions show free diffusion, with no increased signal on DWI. This finding points away from an abscess as the cause.
In this case we can see the centre of the lesions are low signal on DWI meaning there is ‘free diffusion’ pointing away from abscess formation.
What is DWI?
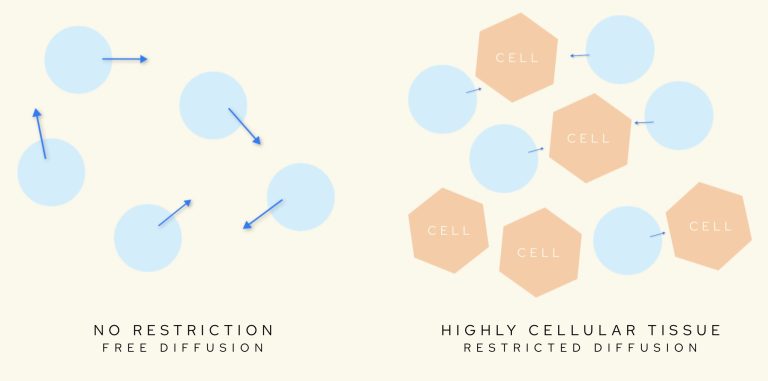
Let’s go into DWI in a bit more detail. Diffusion-weighted imaging (DWI) is a powerful MRI sequence that provides insights into how water molecules move (or diffuse) within tissues. Have a look at the diagrams below.
In cases of highly cellular tissue, water molecules are ‘restricted’ – the basis of diffusion-weighed imaging (DWI).
How Does DWI Work?
DWI sequences are created by applying gradients at varying “b values,” which influence how much signal is lost depending on the movement of water molecules:
At b = 0, the image resembles a standard T2-weighted sequence, where all structures appear relatively bright.
As the b value increases, freely moving water molecules lose more signal, appearing darker, while immobile water molecules retain brightness.
By acquiring images at different b values, we calculate the apparent diffusion coefficient (ADC) for each pixel. The ADC map provides the critical information needed to identify restricted diffusion:
Low ADC values (dark areas on the map) indicate restricted diffusion and typically signify pathology, such as cytotoxic oedema.
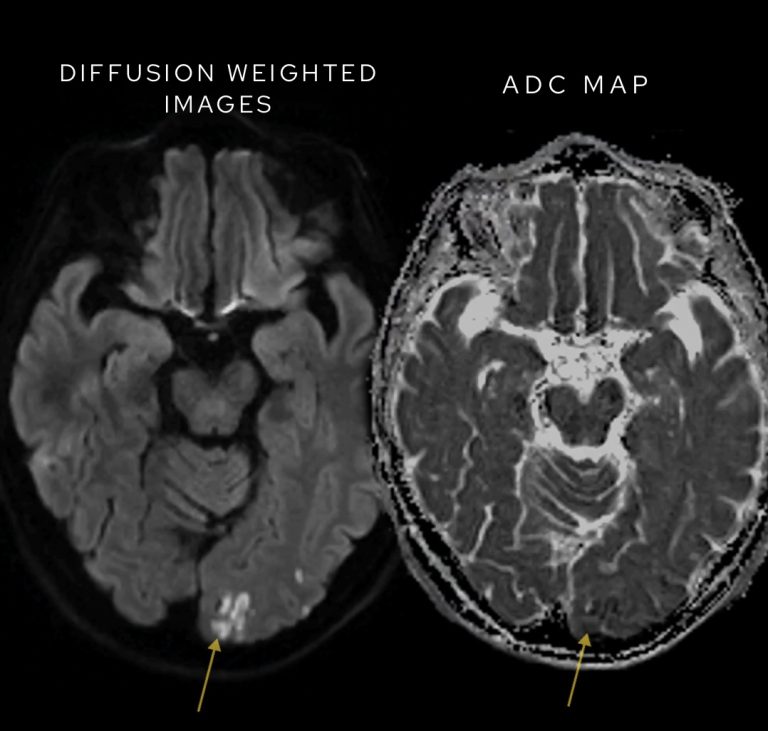
Have a look at this separate case below where we can see restricted diffusion on DWI representing an acute stroke.
Restricted diffusion in a case of ischaemic stroke – high signal on DWI correlates with low signal on ADC.
Clinical Scenarios for DWI Use
Restricted diffusion on DWI is seen in several important clinical contexts:
Acute Ischemic Stroke: DWI is highly sensitive in detecting strokes as early as 30 minutes after onset, long before other imaging modalities can show abnormalities.
High-Cellularity Tumors: Certain tumors, like CNS lymphoma, show restricted diffusion due to their dense cellular structure.
Abscesses: These demonstrate restricted diffusion because pus limits water molecule movement.
Key Points for Interpretation
While bright signal on DWI at higher b values may suggest restricted diffusion, it’s essential to confirm this on the ADC map:
True restricted diffusion corresponds to areas of low ADC values (dark on the map).
Bright spots on DWI without corresponding ADC reduction could simply reflect T2 shine-through, a phenomenon that mimics restricted diffusion but does not indicate pathology.
Practical Tips
Screen DWI images at higher b values for bright foci that suggest restricted diffusion.
Always analyze the ADC map to confirm if these bright foci represent true restriction.
Now let’s go back to our case.
Diagnosis and outcome
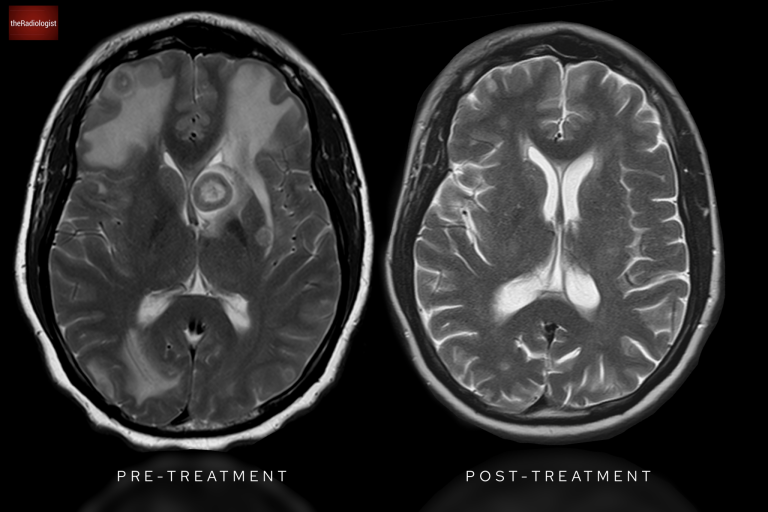
The imaging findings, combined with clinical context, revealed these lesions were due to metastatic breast cancer. Post-chemotherapy imaging shows a remarkable improvement, with the lesions no longer visible.
Post chemotherapy MRI shows resolution of all brain metastases.
KEY POINT
When you see ring-enhancing lesions with vasogenic oedema on brain imaging, remember the ‘MAGIC DR’ differential and remember to use diffusion weighted imaging to help differentiate abscesses from metastases.
FREE GUIDE
Free guide: 20 Chest X-Ray signs you need to recognise
Downloaded by 10,000+ healthcare professionals. Get 20 annotated chest X-ray signs with clear teaching points and explanations. Written by a Consultant Radiologist, this free guide is designed to help you recognise important findings more confidently when reviewing chest X-Rays.
You’ve got the framework now let’s put it to work. Dive into a related case to see these findings on real images, or explore another guide to build out your systematic approach. That’s where it really starts to stick.